3. From Web to Plot
pythonプログラムの実例の一つとして、 Internetで入手可能なデータを取り込んで、グラフ化してみます。 東洋経済オンラインがwebで公開している、Covid19の時系列データを 取り込み、グラフ化してみます。
3.1. web上のデータをダウンロード
まずはweb上で公開されているcsvデータをローカルファイルにダウンロードしてみます。python3ではurllibモジュールのrequestサブモジュールを使って、指定したURLの内容をプログラムを使って読み込むことができます。
このモジュールをプログラムで利用するために、このモジュールをインポート(import)します。
pythonには豊富な標準ライブラリモジュールが用意されています。また、第三者によって提供されているモジュールも豊富です。Pythonでのプログラム開発では、これらのモジュールをうまく使いこなすことがコツの一つです。文献/web pageを利用して必要なモジュールを探してみましょう。
import urllib.request
ここでは、urllib.request モジュールの中の
urlopen()関数だけが必要です。 この様な場合には、urlopen関数だけを選択的にインポートすることができます。
from urllib.request import urlopen
次の行は、 macos上のpythonでhttps::に接続する際にシステムのSSL証明書を 使う様に指示しています。以下の二行をコメントアウトして、実行に問題がなければ不要です。 (私の環境では、必要となっています。)
import os, certifi
os.environ["SSL_CERT_FILE"]=certifi.where()
次にデータをダウンロードするURLのリストを作っておきます。このリストにdataurlsという名前をつけておきます。
### NHKのデータソースはこちら https://www3.nhk.or.jp/n-data/opendata/coronavirus/nhk_news_covid19_prefectures_daily_data.csv
https://www3.nhk.or.jp/n-data/opendata/coronavirus/nhk_news_covid19_prefectures_daily_data.csv
dataurls=(
        "https://toyokeizai.net/sp/visual/tko/covid19/csv/pcr_positive_daily.csv",
        "https://toyokeizai.net/sp/visual/tko/covid19/csv/pcr_tested_daily.csv",
        "https://toyokeizai.net/sp/visual/tko/covid19/csv/cases_total.csv",
        "https://toyokeizai.net/sp/visual/tko/covid19/csv/recovery_total.csv",
        "https://toyokeizai.net/sp/visual/tko/covid19/csv/death_total.csv",
        "https://toyokeizai.net/sp/visual/tko/covid19/csv/pcr_case_daily.csv",
        "https://toyokeizai.net/sp/visual/tko/covid19/csv/severe_daily.csv",
        "https://toyokeizai.net/sp/visual/tko/covid19/csv/effective_reproduction_number.csv",
        "https://toyokeizai.net/sp/visual/tko/covid19/csv/demography.csv",
        "https://toyokeizai.net/sp/visual/tko/covid19/csv/prefectures.csv"
    )
3.2. 東洋経済 オンライン 「新型コロナウイルス国内感染の状況」が使っているデータソース
結局上記のNHKと同じ
厚生労働省オープンデータ「陽性者数」 pcr_positive_daily.csv
厚生労働省オープンデータ「PCR検査実施人数」 pcr_tested_daily.csv
厚生労働省オープンデータ「入院治療等を要する者の数」 cases_total.csv
厚生労働省オープンデータ「退院又は療養解除となった者の数」 recovery_total.csv
厚生労働省オープンデータ「死亡者数」 death_total.csv
厚生労働省オープンデータ「PCR検査の実施件数」 pcr_case_daily.csv
公表日ごとの全国の重症者数 severe_daily.csv
日別全国の実効再生産数 effective_reproduction_number.csv
python3にはデータ(オブジェクト)の並びを表現するためにふたつのデータ形,
リスト( [,] )とタプル( (,) )
が用意されています。リストはデータを作成した後で、要素を変更(取り替え)することができますが、タプルはその要素を変更(取り替え)することができません。URLのリストはプログラム中で変更する必要はありませんから、dataurlsはURLのタプルとして定義しました。
次に、URLで指定されるcsvファイル(csv:comma separated
value,カンマ区切り形式)をローカルファイルにダウンドードする関数 load() を定義します。
def load(dataurl):
    fn=dataurl.split("/")[-1]
    with urlopen(dataurl) as inf , open(fn,"wb") as outf:
        print ("downloading :", fn)
        data=inf.read()
        outf.write(data)
defキーワードを使って、関数load()を定義しています。loadの引数はdataurlです。
関数の本体は、:に続く文で定義します。関数本体のプログラム文はdefキーワードに対してインデントされています。同様にwith文の本体(:のあとの文)もwithに対してインデントされていることに気をつけてください。インデントにTABを使うこともできますが、1byte文字の空白' 'を使うことを推奨します。
このpythonでのブロック構造の表現はちょっと特殊ですが、出来上がったプログラムが読みやすくなることを狙って採用されています。
この関数load() は dataurl
の最後の要素であるファイル名と同じ名前のローカルファイルにデータを保存します。
dataurl の文字列は "/"
を区切りとして切り分けられますdataurl.split("/") 。
切り分けたリストの最後の要素[-1] がファイル名 xxxx.csv です。
urlopen()で確立したwebとの接続を inf,
書き込み用(w)にオープンしたバイナリ形式データ(b)のファイル指示子をoutfとして使うことをwith ... as ...,:構文で宣言しています。
この構文(context
manager)を使うことで、確実にこれらのフィアル/接続がこのセクション実行後に自動的にcloseされることが保証されます。
あとはデータを読み込んで、data=inf.read(),
それをファイルに書き出す、outf.write(data)、だけです。
dataurlsの各要素についてこの関数を呼び出します。
for dataurl in dataurls:
    load(dataurl)
downloading : pcr_positive_daily.csv
downloading : pcr_tested_daily.csv
downloading : cases_total.csv
downloading : recovery_total.csv
downloading : death_total.csv
downloading : pcr_case_daily.csv
downloading : severe_daily.csv
downloading : effective_reproduction_number.csv
downloading : demography.csv
downloading : prefectures.csv
3.3. CSVから SQL Dtabaseへの変換
データの検索などの操作はCVSデータをSQL Database(ここではsqlite3データベースを利用)に変換することで、簡単に行えるようになります。 この変換は色々な手法がありますが、今回試してみた結果pandasのdataframeを経由する方法が簡単確実です。
pandasは最近話題のanacond/minicondaなどでも使われているpythonでのデータ処理向けのライブラリです。
dataframeと呼ばれるデータ構造を提供しており、
単純なアレイ構造を超えた取扱を実現しています。ただ、使いこなしにはある程度の練習が必要な様です。ここではdataframe
の備えるcvs/sqlへの読み書きの機能だけを使います。
まずdataframe形のデータを使える様に、pandasモジュールをインポートしましょう。sqlite3,
os もインポートしておきます。
os.pathモジュールからはsplitext関数だけをインポートしておきます。
import pandas
import sqlite3
from os.path import splitext
import os
次に一つのdataurlについて、先ほどダウンロードした
csvファイルを読み込み、sqlデータベースのテーブルとして追加する関数from_cvs_to_sql()
関数を定義します。
def from_csv_to_df(dataurl):
    fn=dataurl.split("/")[-1]
    df=pandas.read_csv(fn)
    return df

def from_csv_to_sql(dataurl):
    fn=dataurl.split("/")[-1]
    df=from_csv_to_df(fn)
    with sqlite3.connect('covid19.db') as con:
        print ("convert ",splitext(fn)[0])
        df.to_sql(splitext(fn)[0],con)
    os.remove(fn)
import os, certifi
os.environ["SSL_CERT_FILE"]=certifi.where()

try:
    os.remove('covid19.db')
except FileNotFoundError:
    pass
for dataurl in dataurls:
    from_csv_to_sql(dataurl)
convert  pcr_positive_daily
convert  pcr_tested_daily
convert  cases_total
convert  recovery_total
convert  death_total
convert  pcr_case_daily
convert  severe_daily
convert  effective_reproduction_number
convert  demography
convert  prefectures
/Library/Frameworks/Python.framework/Versions/3.9/lib/python3.9/site-packages/pandas/core/generic.py:2778: UserWarning: The spaces in these column names will not be changed. In pandas versions < 0.14, spaces were converted to underscores.
  sql.to_sql(
3.4. sql databaseの確認
作成されたデータベースのschemaをチェックしてみましょう。
sqlite3ではデータベースに含まれるテーブルなどのschme情報は、
sqlite_masterテーブルに存在します。この中のSQL欄をみることで、それぞれのテーブルが持つカラムとそのデータ型を知ることもできますが、sqlite3ではPRAGMA機能を使って、それらの情報を取り出すこともできます。
def dump_table_info(dbf):
    db=sqlite3.connect(dbf)
    cur=db.cursor()
    table_info =cur.execute("select name,sql from sqlite_master where type = 'table'").fetchall()
    for tbl,sql in table_info:
        print ("******* table: {:s} *******".format(tbl))
        print ("sql:",sql)
        print ("------ field info -----")
        cur.execute("PRAGMA table_info({:s});".format(tbl))
        print ("rowid","name","type","nullable","defalut", "pk(primary key)")
        for e in cur.fetchall():
            print (*e)

    print("****** data count in tables ******")
    print( "table\tcout")
    for tbl,sql in table_info:
        cur.execute("select count(*) from %s;"%tbl)
        print (tbl,"\t", cur.fetchone()[0])

dump_table_info("covid19.db")
*** table: pcr_positive_daily ***
sql: CREATE TABLE "pcr_positive_daily" (
"index" INTEGER,
  "日付" TEXT,
  "PCR 検査陽性者数(単日)" REAL
)
------ field info -----
rowid name type nullable defalut pk(primary key)
0 index INTEGER 0 None 0
1 日付 TEXT 0 None 0
2 PCR 検査陽性者数(単日) REAL 0 None 0
*** table: pcr_tested_daily ***
sql: CREATE TABLE "pcr_tested_daily" (
"index" INTEGER,
  "日付" TEXT,
  "PCR 検査実施件数(単日)" REAL
)
------ field info -----
rowid name type nullable defalut pk(primary key)
0 index INTEGER 0 None 0
1 日付 TEXT 0 None 0
2 PCR 検査実施件数(単日) REAL 0 None 0
*** table: cases_total ***
sql: CREATE TABLE "cases_total" (
"index" INTEGER,
  "日付" TEXT,
  "入院治療を要する者" REAL
)
------ field info -----
rowid name type nullable defalut pk(primary key)
0 index INTEGER 0 None 0
1 日付 TEXT 0 None 0
2 入院治療を要する者 REAL 0 None 0
*** table: recovery_total ***
sql: CREATE TABLE "recovery_total" (
"index" INTEGER,
  "日付" TEXT,
  "退院、療養解除となった者" REAL
)
------ field info -----
rowid name type nullable defalut pk(primary key)
0 index INTEGER 0 None 0
1 日付 TEXT 0 None 0
2 退院、療養解除となった者 REAL 0 None 0
*** table: death_total ***
sql: CREATE TABLE "death_total" (
"index" INTEGER,
  "日付" TEXT,
  "死亡者数" REAL
)
------ field info -----
rowid name type nullable defalut pk(primary key)
0 index INTEGER 0 None 0
1 日付 TEXT 0 None 0
2 死亡者数 REAL 0 None 0
*** table: pcr_case_daily ***
sql: CREATE TABLE "pcr_case_daily" (
"index" INTEGER,
  "日付" TEXT,
  "国立感染症研究所" INTEGER,
  "検疫所" INTEGER,
  "地方衛生研究所・保健所" INTEGER,
  "民間検査会社(主に行政検査)" REAL,
  "大学等" REAL,
  "医療機関" REAL,
  "民間検査会社(主に自費検査)" REAL
)
------ field info -----
rowid name type nullable defalut pk(primary key)
0 index INTEGER 0 None 0
1 日付 TEXT 0 None 0
2 国立感染症研究所 INTEGER 0 None 0
3 検疫所 INTEGER 0 None 0
4 地方衛生研究所・保健所 INTEGER 0 None 0
5 民間検査会社(主に行政検査) REAL 0 None 0
6 大学等 REAL 0 None 0
7 医療機関 REAL 0 None 0
8 民間検査会社(主に自費検査) REAL 0 None 0
*** table: severe_daily ***
sql: CREATE TABLE "severe_daily" (
"index" INTEGER,
  "日付" TEXT,
  "重症者数" REAL
)
------ field info -----
rowid name type nullable defalut pk(primary key)
0 index INTEGER 0 None 0
1 日付 TEXT 0 None 0
2 重症者数 REAL 0 None 0
*** table: effective_reproduction_number ***
sql: CREATE TABLE "effective_reproduction_number" (
"index" INTEGER,
  "日付" TEXT,
  "実効再生産数" REAL
)
------ field info -----
rowid name type nullable defalut pk(primary key)
0 index INTEGER 0 None 0
1 日付 TEXT 0 None 0
2 実効再生産数 REAL 0 None 0
*** table: demography ***
sql: CREATE TABLE "demography" (
"index" INTEGER,
  "year" INTEGER,
  "month" INTEGER,
  "date" INTEGER,
  "age_group" TEXT,
  "tested_positive" INTEGER,
  "hospitalized" INTEGER,
  "serious" INTEGER,
  "death" INTEGER
)
------ field info -----
rowid name type nullable defalut pk(primary key)
0 index INTEGER 0 None 0
1 year INTEGER 0 None 0
2 month INTEGER 0 None 0
3 date INTEGER 0 None 0
4 age_group TEXT 0 None 0
5 tested_positive INTEGER 0 None 0
6 hospitalized INTEGER 0 None 0
7 serious INTEGER 0 None 0
8 death INTEGER 0 None 0
*** table: prefectures ***
sql: CREATE TABLE "prefectures" (
"index" INTEGER,
  "year" INTEGER,
  "month" INTEGER,
  "date" INTEGER,
  "prefectureNameJ" TEXT,
  "prefectureNameE" TEXT,
  "testedPositive" REAL,
  "peopleTested" REAL,
  "hospitalized" REAL,
  "serious" REAL,
  "discharged" REAL,
  "deaths" REAL,
  "effectiveReproductionNumber" REAL
)
------ field info -----
rowid name type nullable defalut pk(primary key)
0 index INTEGER 0 None 0
1 year INTEGER 0 None 0
2 month INTEGER 0 None 0
3 date INTEGER 0 None 0
4 prefectureNameJ TEXT 0 None 0
5 prefectureNameE TEXT 0 None 0
6 testedPositive REAL 0 None 0
7 peopleTested REAL 0 None 0
8 hospitalized REAL 0 None 0
9 serious REAL 0 None 0
10 discharged REAL 0 None 0
11 deaths REAL 0 None 0
12 effectiveReproductionNumber REAL 0 None 0
** data count in tables **
table       cout
pcr_positive_daily   570
pcr_tested_daily     550
cases_total          551
recovery_total       557
death_total          541
pcr_case_daily       536
severe_daily         550
effective_reproduction_number        525
demography   10
prefectures          26320
この様に、csvに含まれるデータから、SQL テーブルの各コラムのデータ型も適切に選択されていることがわかります。
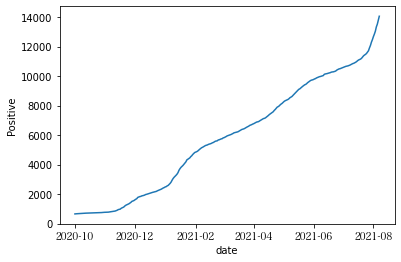
3.5. データのプロット
作成されたデータベースから、茨城県の2021年の日毎の陽性者数の推移をグラフにしてみます。グラフのプロットにはmatplotlibモジュールのpyplotサブモジュールを使います。
また、日付データを適切に取り扱うためにdatetimeモジュールも使います。
#%matplotlib inline #なくても良いようです。
import matplotlib.pyplot as pyplot
import datetime
def plot_positive(pref):
with sqlite3.connect("covid19.db") as db:
cur=db.cursor()
data=cur.execute(
"""
select year, month, date, testedPositive, peopleTested
from prefectures
where prefectureNameJ == \"{}\"
and (year,month) >= (2020,10)
order by year,month,date;
""".format(pref)
).fetchall()
xdata=[datetime.date(y,m,d) for y,m,d,*v in data]
ydata=[v for y,m,d,*v in data]
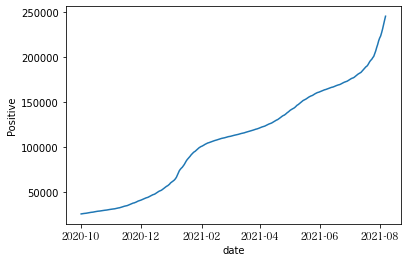
pyplot.xlabel("date")
pyplot.ylabel("Positive")
pyplot.plot(xdata,[v[0] for v in ydata])
pyplot.draw()
locs,labels=pyplot.xticks()
pyplot.xticks(locs[::2], labels[::2],font="Hiragino Mincho ProN")
plot_positive("茨城県")
pyplot.clf()
plot_positive("東京都")
#pyplot.show()
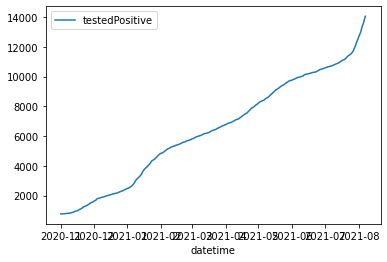
3.6. Dataframe を使って、同様のことができるか確認してみる。
Dataframeを使って同様のグラフを書かせてみた。
loc()メソッドを使うと、SQLのselect相当のことが可能。
StringIOを使うことで、中間のcsvファイルを生成せずにDataFrameに変換ができる。
実はStringIOも使わないで、
urlopenしたobjectからpandas.read_cvsがデータを読み込める。
import io
from io import StringIO, BytesIO
def load_csv_to_df(dataurl):
fn=dataurl.split("/")[-1]
with urlopen(dataurl) as inf:
print ("downloading :", fn)
data=inf.read().decode('utf-8') # binary dataをUnicodeに変換
sio=io.StringIO(data) # dataをStringIOにセット。
df=pandas.read_csv(sio) #
return df
def plot_positive_df(pref):
#load(dataurls[-1]) #csv を読んで
#df=load_csv_to_df(dataurls[-1]) # pandas dataframe に変換
# uriから直接csvを読み込んで、dataframeを作成。
df= pandas.read_csv(urlopen(dataurls[-1]))
# .loc()メソッドを使って、データを選択。
# df=df.loc[(df.prefectureNameJ == "{}".format(pref)) &
# ((df.year > 2020) | ((df.year == 2020) & (df.month >= 10))) , :]
df=df.loc[df.apply(
lambda x:
(x.prefectureNameJ == "{}".format(pref))
and ((x.year,x.month) > (2020,10)), axis=1) , :]
#df=df[df.prefectureNameJ == "{}".format(pref)][(df.year > 2020)]
# "datetime" column を追加。
df['datetime']=df.apply(lambda x:datetime.date(x.year, x.month,x.date), axis=1)
# line plotでプロットしてみる。
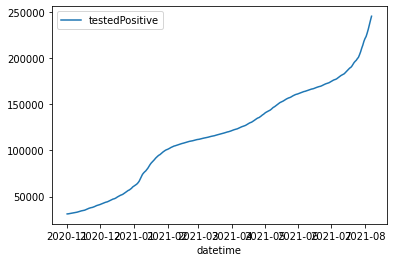
df.plot.line(x="datetime",y="testedPositive")
plot_positive_df("茨城県")
plot_positive_df("東京都")
df= pandas.read_csv(urlopen(dataurls[-1]))
df.info()
<class 'pandas.core.frame.DataFrame'>
RangeIndex: 26320 entries, 0 to 26319
Data columns (total 12 columns):
 #   Column                       Non-Null Count  Dtype
---  ------                       --------------  -----
 0   year                         26320 non-null  int64
 1   month                        26320 non-null  int64
 2   date                         26320 non-null  int64
 3   prefectureNameJ              26320 non-null  object
 4   prefectureNameE              26320 non-null  object
 5   testedPositive               26320 non-null  float64
 6   peopleTested                 24226 non-null  float64
 7   hospitalized                 23767 non-null  float64
 8   serious                      21646 non-null  float64
 9   discharged                   23803 non-null  float64
 10  deaths                       23750 non-null  float64
 11  effectiveReproductionNumber  20513 non-null  float64
dtypes: float64(7), int64(3), object(2)
memory usage: 2.4+ MB
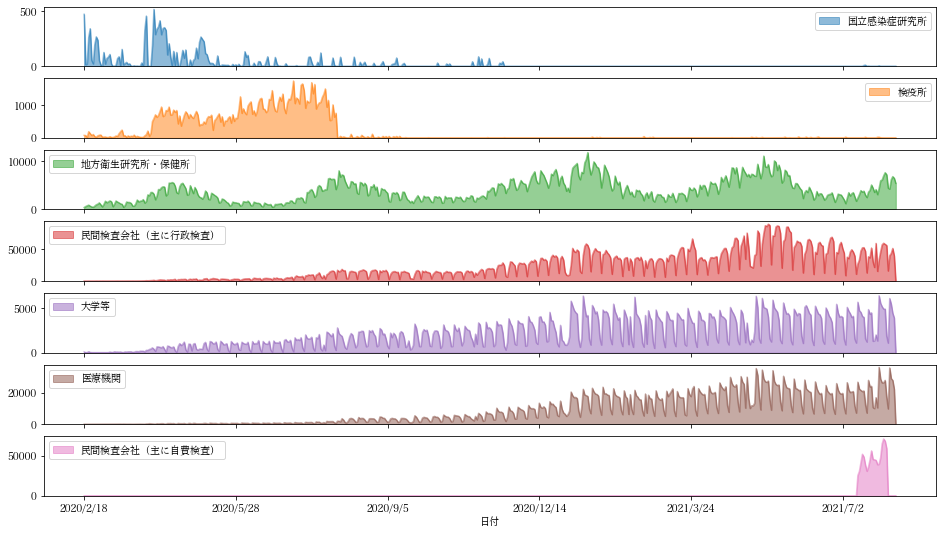
3.7. 日毎検査数データ
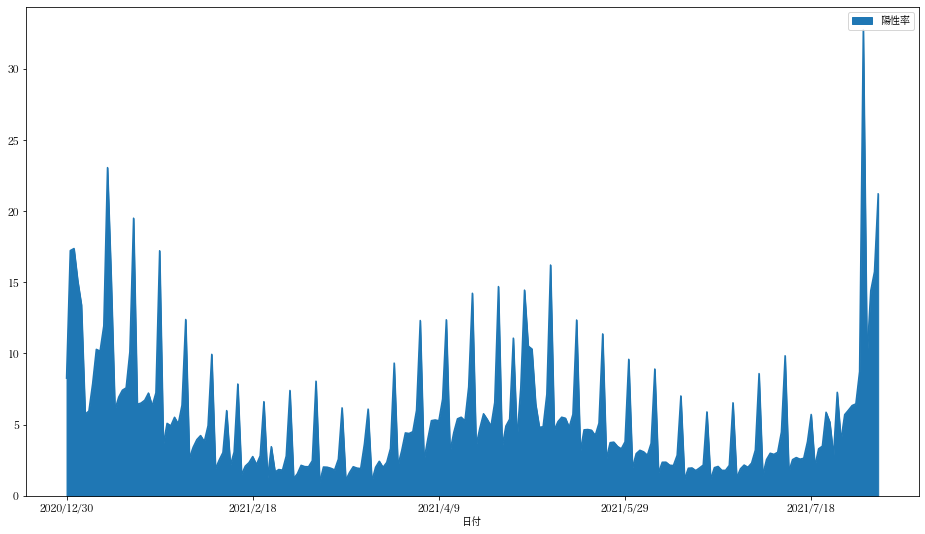
日毎検査数データと日毎感染者数データから感染率を計算しグラフ化することを考えます。
dfcases= pandas.read_csv(urlopen(dataurls[5]))
dfcases
| 日付 | 国立感染症研究所 | 検疫所 | 地方衛生研究所・保健所 | 民間検査会社(主に行政検査) | 大学等 | 医療機関 | 民間検査会社(主に自費検査) | |
|---|---|---|---|---|---|---|---|---|
| 0 | 2020/2/18 | 472 | 75 | 398 | 0.0 | 79.0 | NaN | NaN |
| 1 | 2020/2/19 | 15 | 68 | 609 | 0.0 | 0.0 | NaN | NaN |
| 2 | 2020/2/20 | 20 | 15 | 758 | 0.0 | 0.0 | NaN | NaN |
| 3 | 2020/2/21 | 261 | 188 | 902 | 132.0 | 108.0 | NaN | NaN |
| 4 | 2020/2/22 | 341 | 127 | 677 | 2.0 | 19.0 | NaN | NaN |
| ... | ... | ... | ... | ... | ... | ... | ... | ... |
| 531 | 2021/8/2 | 0 | 0 | 4263 | 39912.0 | 6090.0 | 35588.0 | NaN |
| 532 | 2021/8/3 | 0 | 0 | 6202 | 43194.0 | 5453.0 | 28871.0 | NaN |
| 533 | 2021/8/4 | 0 | 0 | 6846 | 51225.0 | 4425.0 | 27724.0 | NaN |
| 534 | 2021/8/5 | 0 | 0 | 6502 | 39396.0 | 3898.0 | 22087.0 | NaN |
| 535 | 2021/8/6 | 0 | 0 | 5451 | NaN | NaN | NaN | NaN |
536 rows × 8 columns
## 項目:民間検査会社(主に自費検査) 項目:“民間検査会社(主に自費検査)”については2021/7/12から2021/7/31の間以外は全て NaNデータが入っている。 ちなみに東京オリンピック2020は2021/7/13開会式、同8/8に閉会式が催された。
pandas DataFrameの行の一部を取り出すには、indexのスライスあるいは、indexの長さ分のbool値のリストを与える。
DataFrameの列は列名を[]の指定することで要素を取り出せる。これを数値と比較することで, index毎に審理中w
(dfcases["民間検査会社(主に自費検査)"] > 0)
0      False
1      False
2      False
3      False
4      False
       ...
531    False
532    False
533    False
534    False
535    False
Name: 民間検査会社(主に自費検査), Length: 536, dtype: bool
dfcases.loc[(dfcases["民間検査会社(主に自費検査)"] > 0 ),["日付","民間検査会社(主に自費検査)"]]
| 日付 | 民間検査会社(主に自費検査) | |
|---|---|---|
| 510 | 2021/7/12 | 25358.0 |
| 511 | 2021/7/13 | 30454.0 |
| 512 | 2021/7/14 | 40790.0 |
| 513 | 2021/7/15 | 51814.0 |
| 514 | 2021/7/16 | 48333.0 |
| 515 | 2021/7/17 | 38234.0 |
| 516 | 2021/7/18 | 30601.0 |
| 517 | 2021/7/19 | 35979.0 |
| 518 | 2021/7/20 | 44811.0 |
| 519 | 2021/7/21 | 55999.0 |
| 520 | 2021/7/22 | 45280.0 |
| 521 | 2021/7/23 | 44962.0 |
| 522 | 2021/7/24 | 44264.0 |
| 523 | 2021/7/25 | 38820.0 |
| 524 | 2021/7/26 | 39399.0 |
| 525 | 2021/7/27 | 47623.0 |
| 526 | 2021/7/28 | 64759.0 |
| 527 | 2021/7/29 | 70883.0 |
| 528 | 2021/7/30 | 68157.0 |
| 529 | 2021/7/31 | 58996.0 |
help(df.loc)
Help on _LocIndexer in module pandas.core.indexing object: class _LocIndexer(_LocationIndexer) | Access a group of rows and columns by label(s) or a boolean array. | |.loc[]is primarily label based, but may also be used with a | boolean array. | | Allowed inputs are: | | - A single label, e.g.5or'a', (note that5is | interpreted as a label of the index, and never as an | integer position along the index). | - A list or array of labels, e.g.['a', 'b', 'c']. | - A slice object with labels, e.g.'a':'f'. | | .. warning:: Note that contrary to usual python slices, both the | start and the stop are included | | - A boolean array of the same length as the axis being sliced, | e.g.[True, False, True]. | - An alignable boolean Series. The index of the key will be aligned before | masking. | - An alignable Index. The Index of the returned selection will be the input. | - Acallablefunction with one argument (the calling Series or | DataFrame) and that returns valid output for indexing (one of the above) | | See more at Selection by Label. | | Raises | ------ | KeyError | If any items are not found. | IndexingError | If an indexed key is passed and its index is unalignable to the frame index. | | See Also | -------- | DataFrame.at : Access a single value for a row/column label pair. | DataFrame.iloc : Access group of rows and columns by integer position(s). | DataFrame.xs : Returns a cross-section (row(s) or column(s)) from the | Series/DataFrame. | Series.loc : Access group of values using labels. | | Examples | -------- | Getting values | | >>> df = pd.DataFrame([[1, 2], [4, 5], [7, 8]], | ... index=['cobra', 'viper', 'sidewinder'], | ... columns=['max_speed', 'shield']) | >>> df | max_speed shield | cobra 1 2 | viper 4 5 | sidewinder 7 8 | | Single label. Note this returns the row as a Series. | | >>> df.loc['viper'] | max_speed 4 | shield 5 | Name: viper, dtype: int64 | | List of labels. Note using[[]]returns a DataFrame. | | >>> df.loc[['viper', 'sidewinder']] | max_speed shield | viper 4 5 | sidewinder 7 8 | | Single label for row and column | | >>> df.loc['cobra', 'shield'] | 2 | | Slice with labels for row and single label for column. As mentioned | above, note that both the start and stop of the slice are included. | | >>> df.loc['cobra':'viper', 'max_speed'] | cobra 1 | viper 4 | Name: max_speed, dtype: int64 | | Boolean list with the same length as the row axis | | >>> df.loc[[False, False, True]] | max_speed shield | sidewinder 7 8 | | Alignable boolean Series: | | >>> df.loc[pd.Series([False, True, False], | ... index=['viper', 'sidewinder', 'cobra'])] | max_speed shield | sidewinder 7 8 | | Index (same behavior asdf.reindex) | | >>> df.loc[pd.Index(["cobra", "viper"], name="foo")] | max_speed shield | foo | cobra 1 2 | viper 4 5 | | Conditional that returns a boolean Series | | >>> df.loc[df['shield'] > 6] | max_speed shield | sidewinder 7 8 | | Conditional that returns a boolean Series with column labels specified | | >>> df.loc[df['shield'] > 6, ['max_speed']] | max_speed | sidewinder 7 | | Callable that returns a boolean Series | | >>> df.loc[lambda df: df['shield'] == 8] | max_speed shield | sidewinder 7 8 | | Setting values | | Set value for all items matching the list of labels | | >>> df.loc[['viper', 'sidewinder'], ['shield']] = 50 | >>> df | max_speed shield | cobra 1 2 | viper 4 50 | sidewinder 7 50 | | Set value for an entire row | | >>> df.loc['cobra'] = 10 | >>> df | max_speed shield | cobra 10 10 | viper 4 50 | sidewinder 7 50 | | Set value for an entire column | | >>> df.loc[:, 'max_speed'] = 30 | >>> df | max_speed shield | cobra 30 10 | viper 30 50 | sidewinder 30 50 | | Set value for rows matching callable condition | | >>> df.loc[df['shield'] > 35] = 0 | >>> df | max_speed shield | cobra 30 10 | viper 0 0 | sidewinder 0 0 | | Getting values on a DataFrame with an index that has integer labels | | Another example using integers for the index | | >>> df = pd.DataFrame([[1, 2], [4, 5], [7, 8]], | ... index=[7, 8, 9], columns=['max_speed', 'shield']) | >>> df | max_speed shield | 7 1 2 | 8 4 5 | 9 7 8 | | Slice with integer labels for rows. As mentioned above, note that both | the start and stop of the slice are included. | | >>> df.loc[7:9] | max_speed shield | 7 1 2 | 8 4 5 | 9 7 8 | | Getting values with a MultiIndex | | A number of examples using a DataFrame with a MultiIndex | | >>> tuples = [ | ... ('cobra', 'mark i'), ('cobra', 'mark ii'), | ... ('sidewinder', 'mark i'), ('sidewinder', 'mark ii'), | ... ('viper', 'mark ii'), ('viper', 'mark iii') | ... ] | >>> index = pd.MultiIndex.from_tuples(tuples) | >>> values = [[12, 2], [0, 4], [10, 20], | ... [1, 4], [7, 1], [16, 36]] | >>> df = pd.DataFrame(values, columns=['max_speed', 'shield'], index=index) | >>> df | max_speed shield | cobra mark i 12 2 | mark ii 0 4 | sidewinder mark i 10 20 | mark ii 1 4 | viper mark ii 7 1 | mark iii 16 36 | | Single label. Note this returns a DataFrame with a single index. | | >>> df.loc['cobra'] | max_speed shield | mark i 12 2 | mark ii 0 4 | | Single index tuple. Note this returns a Series. | | >>> df.loc[('cobra', 'mark ii')] | max_speed 0 | shield 4 | Name: (cobra, mark ii), dtype: int64 | | Single label for row and column. Similar to passing in a tuple, this | returns a Series. | | >>> df.loc['cobra', 'mark i'] | max_speed 12 | shield 2 | Name: (cobra, mark i), dtype: int64 | | Single tuple. Note using[[]]returns a DataFrame. | | >>> df.loc[[('cobra', 'mark ii')]] | max_speed shield | cobra mark ii 0 4 | | Single tuple for the index with a single label for the column | | >>> df.loc[('cobra', 'mark i'), 'shield'] | 2 | | Slice from index tuple to single label | | >>> df.loc[('cobra', 'mark i'):'viper'] | max_speed shield | cobra mark i 12 2 | mark ii 0 4 | sidewinder mark i 10 20 | mark ii 1 4 | viper mark ii 7 1 | mark iii 16 36 | | Slice from index tuple to index tuple | | >>> df.loc[('cobra', 'mark i'):('viper', 'mark ii')] | max_speed shield | cobra mark i 12 2 | mark ii 0 4 | sidewinder mark i 10 20 | mark ii 1 4 | viper mark ii 7 1 | | Method resolution order: | _LocIndexer | _LocationIndexer | pandas._libs.indexing.NDFrameIndexerBase | builtins.object | | Data and other attributes defined here: | | __annotations__ = {'_takeable': <class 'bool'>} | | ---------------------------------------------------------------------- | Methods inherited from _LocationIndexer: | | __call__(self, axis=None) | Call self as a function. | | __getitem__(self, key) | | __setitem__(self, key, value) | | ---------------------------------------------------------------------- | Data descriptors inherited from _LocationIndexer: | | __dict__ | dictionary for instance variables (if defined) | | __weakref__ | list of weak references to the object (if defined) | | ---------------------------------------------------------------------- | Data and other attributes inherited from _LocationIndexer: | | axis = None | | ---------------------------------------------------------------------- | Methods inherited from pandas._libs.indexing.NDFrameIndexerBase: | | __init__(self, /, *args, **kwargs) | Initialize self. See help(type(self)) for accurate signature. | | __reduce__ = __reduce_cython__(...) | | __setstate__ = __setstate_cython__(...) | | ---------------------------------------------------------------------- | Static methods inherited from pandas._libs.indexing.NDFrameIndexerBase: | | __new__(*args, **kwargs) from builtins.type | Create and return a new object. See help(type) for accurate signature. | | ---------------------------------------------------------------------- | Data descriptors inherited from pandas._libs.indexing.NDFrameIndexerBase: | | name | | ndim | | obj
#pyplot.style.use('ggplot')
import matplotlib
font = {'family' : "Hiragino Mincho ProN"}
matplotlib.rc('font', **font)
dfcases.plot("日付",kind="area",stacked=False,figsize=(16,9),subplots=True)
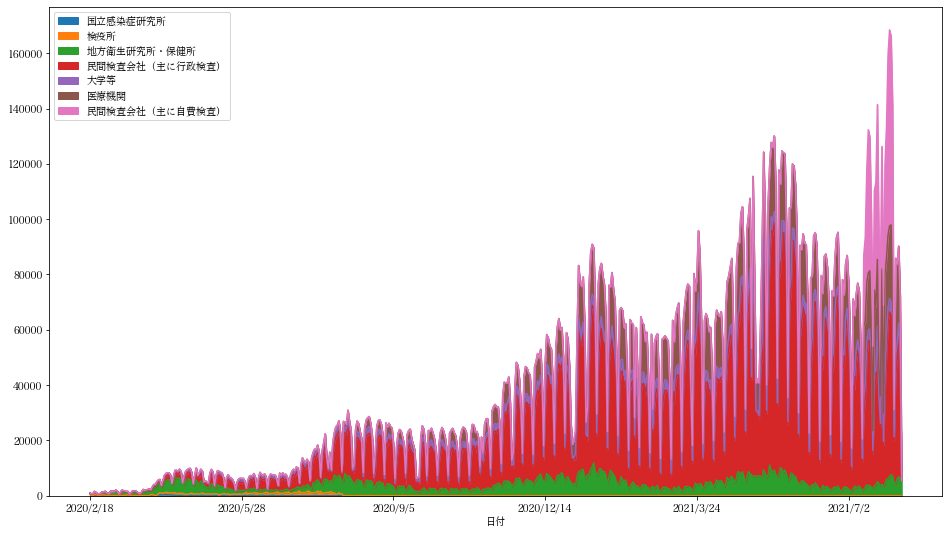
dfcases.plot("日付",kind="area",stacked=True,figsize=(16,9))
<AxesSubplot:xlabel='日付'>
df.sum(axis=1)
0          2048.00
1          2047.00
2          2047.00
3          2047.00
4          2047.00
           ...
26315     91777.46
26316     55309.24
26317     80013.63
26318    142069.24
26319     84154.86
Length: 26320, dtype: float64
3.7.1. 各行毎の和を計算する。
各列毎の総和を求める。
また、各行の和を求め、新い列totalとして追加する。
grand_total = dfcases.sum(axis=0)
dftotal=dfcases.copy()
dftotal["total"]=dftotal.sum(axis=1)
grand_total
日付                2020/2/182020/2/192020/2/202020/2/212020/2/222...
国立感染症研究所                                                      12192
検疫所                                                          108640
地方衛生研究所・保健所                                                 2091278
民間検査会社(主に行政検査)                                           12265627.0
大学等                                                       1138452.0
医療機関                                                      4651157.0
民間検査会社(主に自費検査)                                             925516.0
dtype: object
dftotal
| 日付 | 国立感染症研究所 | 検疫所 | 地方衛生研究所・保健所 | 民間検査会社(主に行政検査) | 大学等 | 医療機関 | 民間検査会社(主に自費検査) | total | |
|---|---|---|---|---|---|---|---|---|---|
| 0 | 2020/2/18 | 472 | 75 | 398 | 0.0 | 79.0 | NaN | NaN | 1024.0 |
| 1 | 2020/2/19 | 15 | 68 | 609 | 0.0 | 0.0 | NaN | NaN | 692.0 |
| 2 | 2020/2/20 | 20 | 15 | 758 | 0.0 | 0.0 | NaN | NaN | 793.0 |
| 3 | 2020/2/21 | 261 | 188 | 902 | 132.0 | 108.0 | NaN | NaN | 1591.0 |
| 4 | 2020/2/22 | 341 | 127 | 677 | 2.0 | 19.0 | NaN | NaN | 1166.0 |
| ... | ... | ... | ... | ... | ... | ... | ... | ... | ... |
| 531 | 2021/8/2 | 0 | 0 | 4263 | 39912.0 | 6090.0 | 35588.0 | NaN | 85853.0 |
| 532 | 2021/8/3 | 0 | 0 | 6202 | 43194.0 | 5453.0 | 28871.0 | NaN | 83720.0 |
| 533 | 2021/8/4 | 0 | 0 | 6846 | 51225.0 | 4425.0 | 27724.0 | NaN | 90220.0 |
| 534 | 2021/8/5 | 0 | 0 | 6502 | 39396.0 | 3898.0 | 22087.0 | NaN | 71883.0 |
| 535 | 2021/8/6 | 0 | 0 | 5451 | NaN | NaN | NaN | NaN | 5451.0 |
536 rows × 9 columns
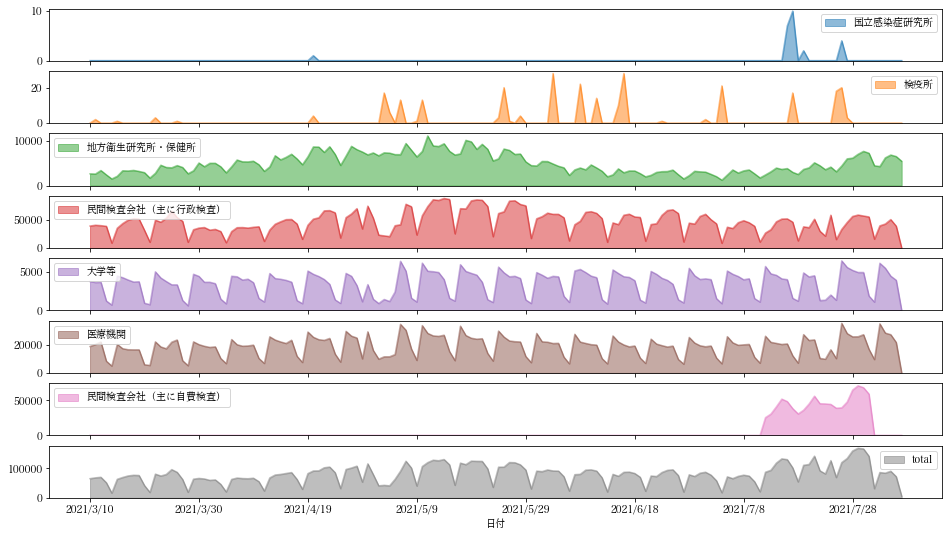
このデータフレームをプロットし、新しい列“total”が追加されていることを確認。
dftotal[-150:].plot("日付",kind="area",stacked=False,figsize=(16,9),subplots=True)
array([<AxesSubplot:xlabel='日付'>, <AxesSubplot:xlabel='日付'>,
       <AxesSubplot:xlabel='日付'>, <AxesSubplot:xlabel='日付'>,
       <AxesSubplot:xlabel='日付'>, <AxesSubplot:xlabel='日付'>,
       <AxesSubplot:xlabel='日付'>, <AxesSubplot:xlabel='日付'>], dtype=object)
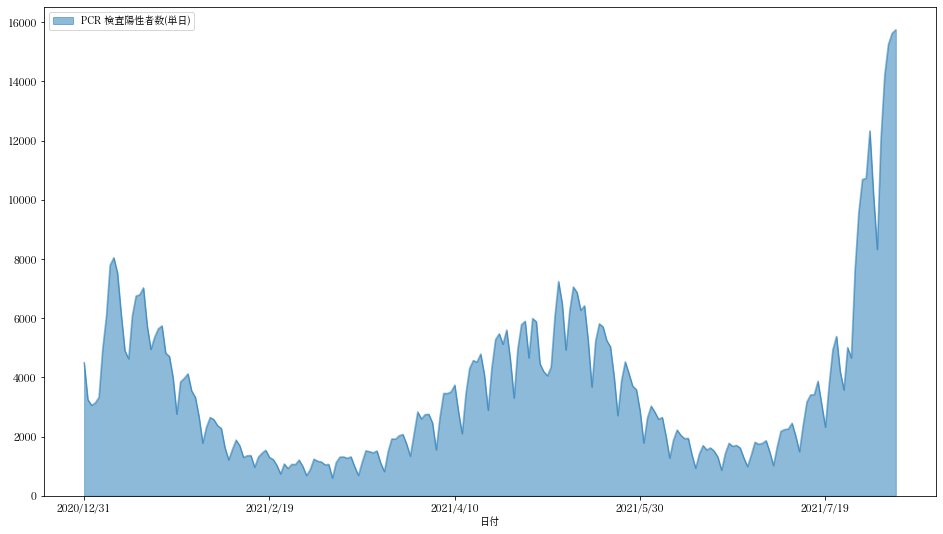
この検査数データ(dftotal)と日毎陽性者のデータ(pcr_positive_daily.cs->dfpositive
)を付き合わせてみます。
dfpositive= pandas.read_csv(urlopen(dataurls[0]))
dfpositive[-220:].plot("日付",kind="area",stacked=False,figsize=(16,9),subplots=True)
array([<AxesSubplot:xlabel='日付'>], dtype=object)
二つのDataframeをJOINするにはDataFrame.merge関数が便利です。ほぼSQL文のJOINになっています。
DataFrame.joinではジョインするキーとして Indexを使うことが必要となります。
mergeを使って、二つのデータセットの共通部分を取り出し、マージします。
マージ後のデータフレームに新しい列“陽性率”を追加します。
# SQLのJOINに対応するものは DataFrame.mergeと考えた方がいい様です。DataFrame.joinはindexでのjoinnを仮定している様です。
dfjoin=dftotal.merge(dfpositive,left_on="日付",right_on="日付", how="inner")
dfjoin["陽性率"]=dfjoin["PCR 検査陽性者数(単日)"]/dfjoin["total"]*100
dfjoin[-220:-1].plot("日付",["陽性率"],kind="area",figsize=(16,9))
#pyplot.savefig("陽性率.png")
<AxesSubplot:xlabel='日付'>
3.8. データフレーム:列へのアクセス
DataFrameの各列へのアクセスは幾つかの方法がある。
dftotal["日付"], dftotal.日付, dftotal.loc[:,"日付"],dftotal.iloc[:,0]
(0      2020/2/18
 1      2020/2/19
 2      2020/2/20
 3      2020/2/21
 4      2020/2/22
          ...
 531     2021/8/2
 532     2021/8/3
 533     2021/8/4
 534     2021/8/5
 535     2021/8/6
 Name: 日付, Length: 536, dtype: object,
 0      2020/2/18
 1      2020/2/19
 2      2020/2/20
 3      2020/2/21
 4      2020/2/22
          ...
 531     2021/8/2
 532     2021/8/3
 533     2021/8/4
 534     2021/8/5
 535     2021/8/6
 Name: 日付, Length: 536, dtype: object,
 0      2020/2/18
 1      2020/2/19
 2      2020/2/20
 3      2020/2/21
 4      2020/2/22
          ...
 531     2021/8/2
 532     2021/8/3
 533     2021/8/4
 534     2021/8/5
 535     2021/8/6
 Name: 日付, Length: 536, dtype: object,
 0      2020/2/18
 1      2020/2/19
 2      2020/2/20
 3      2020/2/21
 4      2020/2/22
          ...
 531     2021/8/2
 532     2021/8/3
 533     2021/8/4
 534     2021/8/5
 535     2021/8/6
 Name: 日付, Length: 536, dtype: object)
複数の列を取り出すことも可能です。
dfcases[["日付", "医療機関"]]
| 日付 | 医療機関 | |
|---|---|---|
| 0 | 2020/2/18 | NaN |
| 1 | 2020/2/19 | NaN |
| 2 | 2020/2/20 | NaN |
| 3 | 2020/2/21 | NaN |
| 4 | 2020/2/22 | NaN |
| ... | ... | ... |
| 531 | 2021/8/2 | 35588.0 |
| 532 | 2021/8/3 | 28871.0 |
| 533 | 2021/8/4 | 27724.0 |
| 534 | 2021/8/5 | 22087.0 |
| 535 | 2021/8/6 | NaN |
536 rows × 2 columns
3.9. 選択
さらに条件にあう行だけを選択してみます。
dfcases[["日付", "医療機関"]][dfcases["医療機関"]>0]
| 日付 | 医療機関 | |
|---|---|---|
| 17 | 2020/3/6 | 68.0 |
| 18 | 2020/3/7 | 44.0 |
| 19 | 2020/3/8 | 9.0 |
| 20 | 2020/3/9 | 48.0 |
| 21 | 2020/3/10 | 62.0 |
| ... | ... | ... |
| 530 | 2021/8/1 | 9684.0 |
| 531 | 2021/8/2 | 35588.0 |
| 532 | 2021/8/3 | 28871.0 |
| 533 | 2021/8/4 | 27724.0 |
| 534 | 2021/8/5 | 22087.0 |
518 rows × 2 columns