2.8. 数独の生成#

PlantUMLには、数独のパズルを生成する機能も搭載されています...

GPLV3/GPLV2のバージョンのPlantUMLが必要です。(LGPLバージョンでは不可)

sudoku

sudoku 45azkdf4sqq

GPLV3/GPLV2のバージョンのPlantUMLでは、 Sudokuの他にも DITAA, JccKit, Xearthという拡張も利用できます。

2.9. DITAA#

Ditaa (DIagrams Through Ascii Art) は、テキストで書かれた図の記述を一般的な図に変換するオープンソースのプロジェクトです。 アイデアとしては PlantUML に近いもので、ドキュメントのために UML 以外の図を生成したい場合には役に立つことがあります。 とはいうものの、Dittaの入力はASCIIアートの図のようなものなので、どのくらい実用になるのかは不明です。 EmacsにはAscii Art向けにPicture modeがあるそうです。これで作成すれば、簡単かも?

リスト 2.1 DITAA 入力例#
@startditaa -E --no-shadow -scale=1.2
+--------+   +-------+    +-------+
|        +---+ ditaa +--> |       |
|  Text  |   +-------+    |diagram|
|Document|   |!magic!|    |       |
|     {d}|   |       |    |       |
+---+----+   +-------+    +-------+
    :                         ^
    |       Lots of work      |
    +-------------------------+
@endditaa
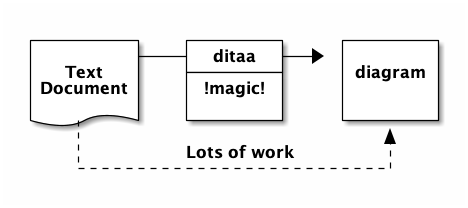
ditaa diagram

図 2.41 DITAA 図 (png)#

http://localhost:8080/plantuml/png/ut8eBaaiAad9B4bCLD1rvUBIreK2RGK51MqaDeB3LQC01TfWEOXc8DjE0IPJ0r8JabfHeW0MGZ6d9YKpCRqeCHUenYK_kJGtDQy4fAP6CJSnFJDP4Mm4YZb0K9rIMuCiZAe6x0m2RWRnh1HmWJWkP1DzyakA5VBJ5ChpYx9XTY2RXWcqkRWSKlDIm24100==

図 2.42 PlantUML picoserveによって作成した画像#

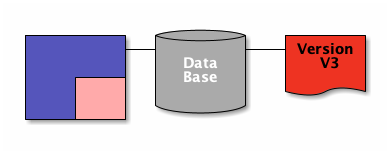
@startditaa -E

+---------+  /--------\   +-------+
| cBLU    +--+cAAA    +---+Version|
|         |  |  Data  |   |   V3  |
|    +----+  |  Base  |   |cRED{d}|
|    |cPNK|  |     {s}|   +-------+
|    |    |  \---+----/
+----+----+
@endditaa

図 2.43 DITAA による図#

2.9.1. JccKit#

JCCKit is a nice and small library for creating scientific charts and plots. Like PlantUML, it's a very text oriented solution written in Java.

JCCKitは 科学的なチャートやプロットを作成するよくできた小さなライブラリです。 PlantUMLのように、 Javaで開発されたテキスト指向の解決方法です。

@startjcckit(600,300)
data/curves = curve2 errors2 curve1 errors1
data/curve1/title = curve 1
data/curve1/x = 0.02 0.11  0.18  0.3   0.42  0.49 0.61
data/curve1/y = 0.68 0.61  0.52  0.41  0.27  0.21 0.11
data/errors1/x = 0.021 0.01  0.017 0.024 0.023 0.025 0.027
data/errors1/y = 0.034 0.028 0.031 0.039 0.03  0.032 0.041
data/curve2/title = curve 2
data/curve2/x = 0.4   0.5  0.6   0.7   0.8   0.9
data/curve2/y = 0.17  0.29 0.45  0.61  0.64  0.66
data/errors2/x = 0 0 0 0 0 0
data/errors2/y = 0.05 0.036 0.059 0.07 0.061 0.053

background = White

defaultCoordinateSystem/ticLabelAttributes/fontSize = 0.03
defaultCoordinateSystem/axisLabelAttributes/fontSize = 0.04
defaultCoordinateSystem/axisLabelAttributes/fontStyle = bold
plot/coordinateSystem/xAxis/ = defaultCoordinateSystem/
plot/coordinateSystem/xAxis/minimum =        0.1
plot/coordinateSystem/yAxis/ = defaultCoordinateSystem/

plot/initialHintForNextCurve/className = jcckit.plot.PositionHint
plot/initialHintForNextCurve/origin = 0.06 0.1
#plot/initialHintForNextCurve/position = 0 0
plot/curveFactory/definitions = cdef1 edef1 cdef2 edef2
plot/curveFactory/cdef1/symbolFactory/className = jcckit.plot.ErrorBarFactory
plot/curveFactory/edef1/symbolFactory/className = jcckit.plot.ErrorBarFactory
plot/curveFactory/edef1/symbolFactory/attributes/className = jcckit.graphic.ShapeAttributes
plot/curveFactory/edef1/symbolFactory/attributes/fillColor = 0xcafe
plot/curveFactory/edef1/symbolFactory/attributes/lineColor = 0
plot/curveFactory/edef1/symbolFactory/size = 0.01
plot/curveFactory/edef1/withLine = false
plot/curveFactory/edef1/softClipping = false
plot/curveFactory/cdef2/symbolFactory/className = jcckit.plot.ErrorBarFactory
plot/curveFactory/cdef2/symbolFactory/symbolFactory/className = jcckit.plot.SquareSymbolFactory
plot/curveFactory/cdef2/symbolFactory/symbolFactory/attributes/className = jcckit.graphic.ShapeAttributes
plot/curveFactory/cdef2/symbolFactory/symbolFactory/attributes/fillColor = 0x40c0
plot/curveFactory/cdef2/symbolFactory/symbolFactory/attributes/lineColor =
plot/curveFactory/edef2/ = plot/curveFactory/edef1/
plot/curveFactory/edef2/symbolFactory/attributes/fillColor =
plot/curveFactory/edef2/symbolFactory/attributes/lineColor = 0
plot/curveFactory/edef2/symbolFactory/size = 0
@endjcckit

@startjcckit(600,300)
data/curves = curve1 curve2 curve3
data/curve1/title = curve 1
data/curve1/x = 0.2 0.3 0.4 0.5
data/curve1/y = 0.3 0.1  0.2 0.35
data/curve2/title = curve 2
data/curve2/x = 0.2  0.3 0.4 0.5 0.6 0.7 0.8
data/curve2/y = 0.25 0.6 0.4 0.6 0.5 0.3 0
data/curve3/title = curve 3
data/curve3/x = 0.5  0.6  0.7  0.8  0.9
data/curve3/y = 0.55 0.54 1.65 0.35 0.73
paper = 0 0 1 0.6
background = 0xffffff
plot/initialHintForNextCurve/className = jcckit.plot.PositionHint
plot/initialHintForNextCurve/position = 0 0.1
plot/coordinateSystem/origin = 0.05 0.1
plot/coordinateSystem/xAxis/axisLabel = <x>
plot/coordinateSystem/xAxis/grid = true
plot/coordinateSystem/xAxis/gridAttributes/lineColor = 0x808080
plot/coordinateSystem/xAxis/automaticTicCalculation = false
plot/coordinateSystem/xAxis/numberOfTics = 6
plot/coordinateSystem/xAxis/ticLabelAttributes/fontSize = 0.03
plot/coordinateSystem/xAxis/axisLabelAttributes/fontSize = 0.05
plot/coordinateSystem/xAxis/axisLabelAttributes/textColor = 0xaa
plot/coordinateSystem/yAxis/axisLabel = factor
plot/coordinateSystem/yAxis/axisLabelPosition = 0.85 0.1
plot/coordinateSystem/yAxis/axisLabelAttributes/fontSize = 0.05
plot/coordinateSystem/yAxis/axisLabelAttributes/textColor = 0xee
plot/coordinateSystem/yAxis/axisLabelAttributes/verticalAnchor = top
plot/coordinateSystem/yAxis/ticLength = -0.006
plot/coordinateSystem/yAxis/ticLabelPosition = 0.81 0
plot/coordinateSystem/yAxis/ticLabelAttributes/fontSize = 0.03
plot/coordinateSystem/yAxis/ticLabelAttributes/fontStyle = bold
plot/coordinateSystem/yAxis/ticLabelAttributes/horizontalAnchor = left
defaultDefinition/symbolFactory/className = jcckit.plot.SquareSymbolFactory
defaultDefinition/symbolFactory/size = 0.015
defaultDefinition/symbolFactory/attributes/className = jcckit.graphic.BasicGraphicAttributes
defaultDefinition/symbolFactory/attributes/lineColor = 0
defaultDefinition/symbolFactory/attributes/lineThickness = 0.002
defaultDefinition/lineAttributes/className = jcckit.graphic.ShapeAttributes
defaultDefinition/lineAttributes/linePattern = 0.01 0.005
defaultDefinition/lineAttributes/lineThickness = 0.005
defaultDefinition/lineAttributes/lineColor = 0xca
plot/curveFactory/definitions = def1 def2 def3
plot/curveFactory/def1/ = defaultDefinition/
plot/curveFactory/def1/symbolFactory/className = jcckit.plot.BarFactory
plot/curveFactory/def1/symbolFactory/size = 0.03
plot/curveFactory/def1/symbolFactory/attributes/fillColor = 0xffca00
plot/curveFactory/def1/withLine = false
plot/curveFactory/def2/ = defaultDefinition/
plot/curveFactory/def2/symbolFactory/className = jcckit.plot.CircleSymbolFactory
plot/curveFactory/def2/symbolFactory/attributes/fillColor = 0x8000
plot/curveFactory/def2/symbolFactory/attributes/lineColor =
plot/curveFactory/def3/ = defaultDefinition/
plot/legend/upperRightCorner = 0.84 0.54
plot/legend/boxAttributes/fillColor = 0xeeeeee
plot/legend/lineLength = 0.035
@endjcckit

2.9.1.1. xearth#

XEarth is a unix utility written in 1993 by Kirk Lauritz Johnson. It has been ported to Java by Christian Treber. So it was easy to integrate it into PlantUML, even if it won't probably help for documentation.

xearth

xearth(300,300)
gridP = true
gridDivision = 9
gridPixelDivision = 8

図 2.44 Change grid configuration#

xearth(300,300)
viewPositionType = Orbit
orbitPeriod = 1
orbitInclination = 30
daySideBrightness = 100
nightSideBrightness = 30
terminatorDiscontinuity = 50

図 2.45 View set by orbit and changing luminosity#

xearth(300,300)
viewPositionType = Moon
daySideBrightness = 100
nightSideBrightness = 30
terminatorDiscontinuity = 50

図 2.46 View from Moon and changing luminosity#

xearth
61.17 -150.00 "Anchorage"           # Alaska, USA
38.00   23.73 "Athens"              # Greece
33.4    44.4  "Baghdad"             # Iraq
13.73  100.50 "Bangkok"             # Thailand
39.92  116.43 "Beijing"             # China
52.53   13.42 "Berlin"              # Germany
32.3   -64.7  "Bermuda"             # Bermuda
42.33  -71.08 "Boston"              # Massachusetts, USA
-15.8   -47.9  "Brasilia"            # Brazil
-4.2    15.3  "Brazzaville"         # Congo
-34.67  -58.50 "Buenos Aires"        # Argentina
31.05   31.25 "Cairo"               # Egypt
22.5    88.3  "Calcutta"            # India
-33.93   18.47 "Cape Town"           # South Africa
33.6    -7.6  "Casablanca"          # Morocco (Rabat?)
41.83  -87.75 "Chicago"             # Illinois, USA
32.78  -96.80 "Dallas"              # Texas, USA
28.63   77.20 "New Delhi"           # India
39.75 -105.00 "Denver"              # Colorado, USA
24.23   55.28 "Dubai"               # UAE (Abu Dhabi?)
-27.1  -109.4  "Easter Island"       # Easter Island
-18.0   178.1  "Fiji"                # Fiji
13.5   144.8  "Guam"                # Guam
60.13   25.00 "Helsinki"            # Finland
22.2   114.1  "Hong Kong"           # Hong Kong
21.32 -157.83 "Honolulu"            # Hawaii, USA
52.2   104.3  "Irkutsk"             # Irkutsk, Russia
41.0    29.0  "Istanbul"            # Turkey (Ankara?)
-6.13  106.75 "Jakarta"             # Indonesia
31.8    35.2  "Jerusalem"           # Israel
34.5    69.2  "Kabul"               # Afghanistan
27.7    85.3  "Kathmandu"           # Nepal
50.4    30.5  "Kiev"                # Ukraine
3.13  101.70 "Kuala Lumpur"        # Malaysia
6.45    3.47 "Lagos"               # Nigeria
-12.10  -77.05 "Lima"                # Peru
51.50   -0.17 "London"              # United Kingdom
40.42   -3.72 "Madrid"              # Spain
14.6   121.0  "Manila"              # The Phillipines
21.5    39.8  "Mecca"               # Saudi Arabia
19.4   -99.1  "Mexico City"         # Mexico
25.8   -80.2  "Miami"               # Florida, USA
6.2   -10.8  "Monrovia"            # Liberia
45.5   -73.5  "Montreal"            # Quebec, Canada
55.75   37.70 "Moscow"              # Russia
-1.28   36.83 "Nairobi"             # Kenya
59.93   10.75 "Oslo"                # Norway
48.87    2.33 "Paris"               # France
-32.0   115.9  "Perth"               # Australia
45.5  -122.5  "Portland"            # Oregon, USA
-0.2   -78.5  "Quito"               # Ecuador
64.15  -21.97 "Reykjavik"           # Iceland
-22.88  -43.28 "Rio de Janeiro"      # Brazil
41.88   12.50 "Rome"                # Italy
11.0   106.7  "Ho Chi Minh City"    # Vietnam (Hanoi?)
37.75 -122.45 "San Francisco"       # California, USA
9.98  -84.07 "San Jose"            # Costa Rica
18.5   -66.1  "San Juan"            # Puerto Rico
-33.5   -70.7  "Santiago"            # Chile
1.2   103.9  "Singapore"           # Singapore
42.67   23.30 "Sofia"               # Bulgaria
59.33   18.08 "Stockholm"           # Sweden
-33.92  151.17 "Sydney"              # Australia
-17.6  -149.5  "Tahiti"              # Tahiti
16.8    -3.0  "Timbuktu"            # Mali (Bamako?)
35.67  139.75 "Tokyo"               # Japan
43.70  -79.42 "Toronto"             # Ontario, Canada
32.9    13.2  "Tripoli"             # Libya
47.9   106.9  "Ulan Bator"          # Mongolia
49.22 -123.10 "Vancouver"           # B.C., Canada
48.22   16.37 "Vienna"              # Austria
38.9   -77.0  "Washington"          # United States
-41.28  174.78 "Wellington"          # New Zealand
62.5  -114.3  "Yellowknife"         # N.T., Canada
90.00    0.00 "North Pole"          # North Pole
-90.00    0.00 "South Pole"          # South Pole

図 2.47 Adding cities#