3.1. blockdiag#
blockdiagはSphinx ドキュメントに組織図や流れ図などを作成するためのExtensionです。 blockdiagはSphinxのみならず、iPython, Track, moinmoin, mediawiki, Pukiwikiなどにも ブロック図を埋め込む事ができます. blockdiagは日本人によって開発され、ホームページも日本語で提供されています。 (http://blockdiag.com/ja/index.html)
blockdiagのシリーズには、数種類の図に対応した、
などの兄弟姉妹パッケージがあります。
ブロック図、シーケンス図、アクテビティ図、論理ネットワーク図は、 ほぼ同等 の図をPlantUMLを用いて作成できます。
ラック配置図、パケット構成図についてはは同等の機能がPlantUMLには用意されていません。 nwdiagと同じ様に、移植することも不可能ではないように思われますが、いまのところは工夫して使って行くしかない様です。
以下では、blockdiagの入力データとそれに対応するPlatUMLの出力結果を示します。
3.1.1. blockdiag examples#
blockdiag admin {
     top_page -> config -> config_edit -> config_confirm -> top_page;
}

図 3.1 blockdiagコマンドによって作成した図(png)。#

図 3.2 blockdiag による作図の一例(sphinx ディレクティブ blockdiag を利用)#
図 3.3 plantumlで書き直した図#
blockdiag {
  A -> B -> C -> D;
  A -> E -> F -> D;
}

図 3.4 blockdiag 作例2#
図 3.5 plantUML 作例2#
blockdiag admin {
orientation = portrait

A -> B -> C;
B -> D;

A[label = 1st];
B[label = 2nd];
C[label = 3rd];
D[label = 4th];
}
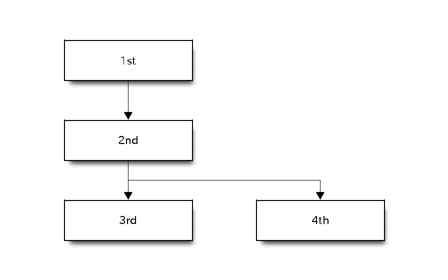
図 3.6 blockdiag 作例3#
図 3.7 作例3のPlantUML版#
blockdiag admin {
index [label = "List of FOOs"];
add [label = "Add FOO"];
add_confirm [label = "Add FOO (confirm)"];
edit [label = "Edit FOO"];
edit_confirm [label = "Edit FOO (confirm)"];
show [label = "Show FOO"];
delete_confirm [label = "Delete FOO (confirm)"];

index -> add  -> add_confirm  -> index;
index -> edit -> edit_confirm -> index;
index -> show -> index;
index -> delete_confirm -> index;
}
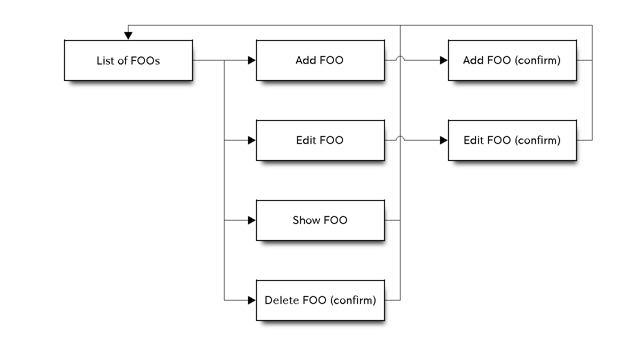
図 3.8 blockdiag 作例4#
図 3.9 plantuml による 作例4#
3.1.2. nwdiag example#
nwdiag {
network dmz {
address = "210.x.x.x/24"

web01 [address = "210.x.x.1"];
web02 [address = "210.x.x.2"];
}
network internal {
address = "172.x.x.x/24";

web01 [address = "172.x.x.1"];
web02 [address = "172.x.x.2"];
db01;
db02;
}
}
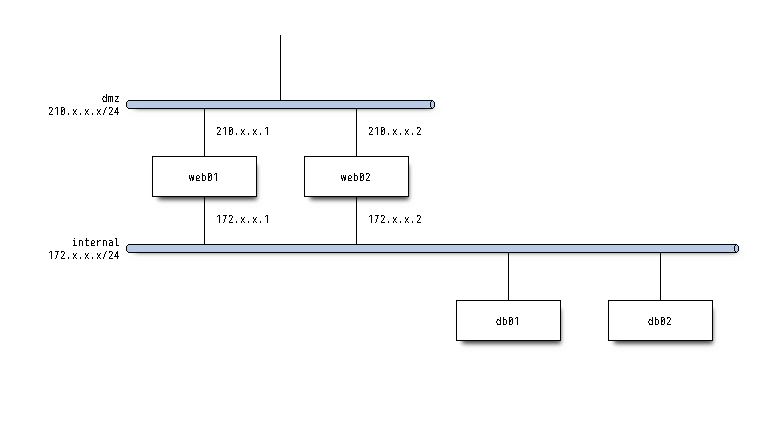
図 3.10 nwdiag によって作成した図#
3.1.3. rackdiag example#
rackdiag {
// define height of rack
16U;

// define rack items
1: UPS [2U];
3: DB Server
4: Web Server
5: Web Server
6: Web Server
7: Load Balancer
8: L3 Switch
}
3.1.4. packetdiag example#
packetdiag{
colwidth = 32
node_height = 72

0-15: Source Port
16-31: Destination Port
32-63: Sequence Number
64-95: Acknowledgment Number
96-99: Data Offset
100-105: Reserved
106: URG [rotate = 270]
107: ACK [rotate = 270]
108: PSH [rotate = 270]
109: RST [rotate = 270]
110: SYN [rotate = 270]
111: FIN [rotate = 270]
112-127: Window
128-143: Checksum
144-159: Urgent Pointer
160-191: (Options and Padding)
192-223: data [colheight = 3]
}
3.1.5. actdiag example#
actdiag {
write -> convert -> image

lane user {
label = "User"
write [label = "Writing reST"];
image [label = "Get diagram IMAGE"];
}
lane actdiag {
convert [label = "Convert reST to Image"];
}
}
3.1.6. seqdiag example#
seqdiag {
browser  -> webserver [label = "GET /index.html"];
browser <-- webserver;
browser  -> webserver [label = "POST /blog/comment"];
webserver  -> database [label = "INSERT comment"];
webserver <-- database;
browser <-- webserver;
}
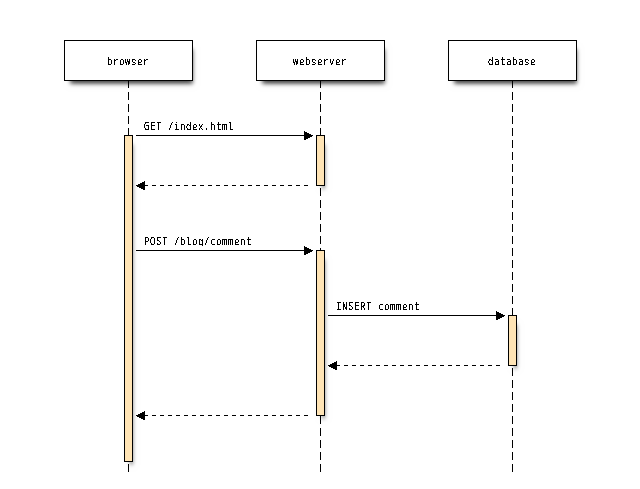
図 3.11 seqdiag コマンドの出力(例1)#
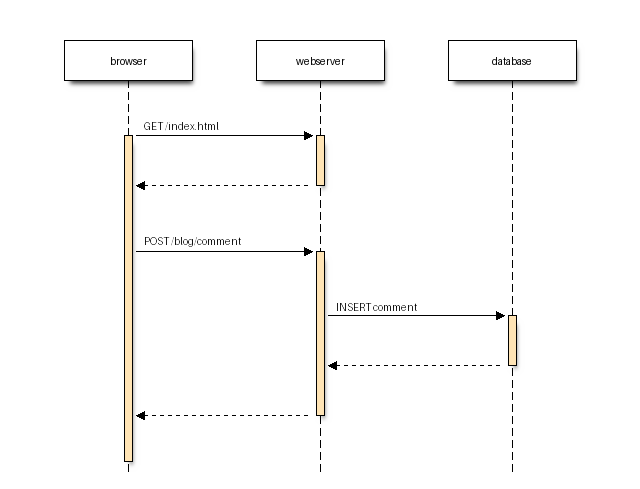
図 3.12 seqdiag directive を使った図#
seqdiag {
// auto return edge
A => B [label = "call", return = "return"];

// nested auto return edge
A => B => C [label = "call", return = "return"];

// nested sequence
A => B [label = "nested call"]{
B => C [label = "call 1"];
B => D [label = "call 2"];
B => E [label = "call 3"];
          }
}
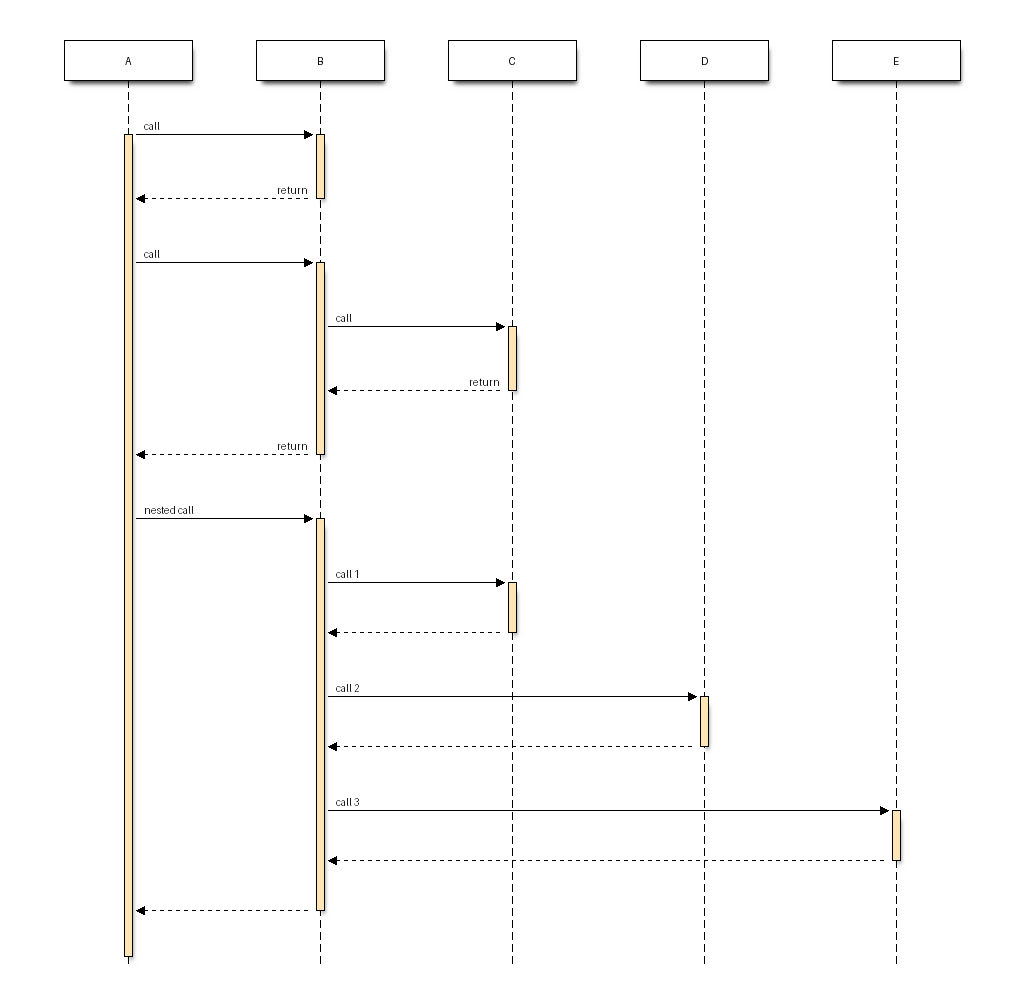
図 3.13 seqdiag 出力例2#
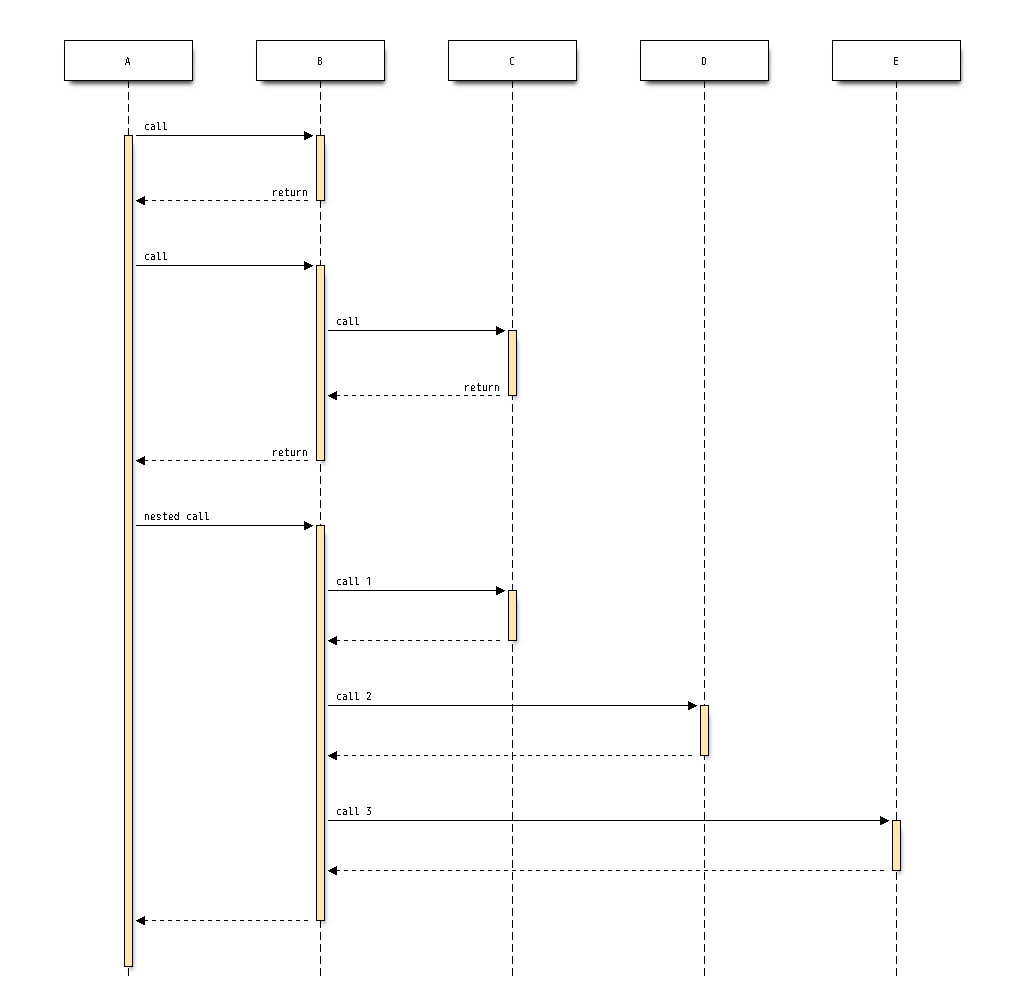
図 3.14 seqdiag コマンドによる出力#
図 3.15 actdiagの例をPlatUMLで書き直して見ました。#
3.1.7. actdiag#
actdiag をPlantUMLのアクティビティ図でおきかえられるかを試して見ます。
http://blockdiag.com/ja/actdiag/examples.html#simple-diagram の例を試してみましょう。
   actdiag {
   write -> convert -> image

   lane user {
   label = "User"
   write [label = "Writing reST"];
   image [label = "Get diagram IMAGE"];
   }
   lane actdiag {
   convert [label = "Convert reST to Image"];
   }
   }
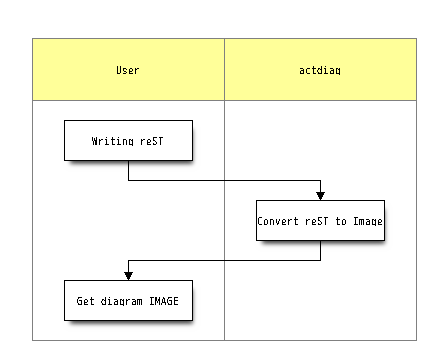
図 3.16 actdiagコマンドによる出力例#
図 3.17 http://blockdiag.com/ja/_images/actdiag-27aec367951ef70f7b5badceebbcc0c2bc687752.png#
デスクリプションをPlantUMLで追加します。
図 3.18 デスクリプションを legend/endlegend とCreole記法を使って追加しました。#
3.1.8. シークエンス図#
seqdiag {
// Use note (put note on rightside)
browser -> webserver [note = "request\nGET /"];
browser <- webserver;

// Use leftnote and rightnote
browser -> webserver [leftnote = "send request"];
browser <- webserver [rightnote = "send response"];
}
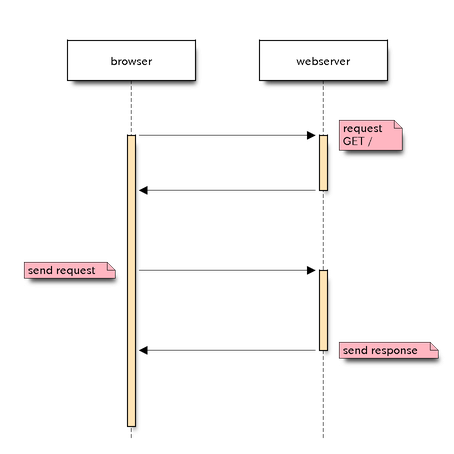
図 3.19 http://blockdiag.com/ja/_images/seqdiag-d86fff2ba41af47bef92201ce99bf44d4235fb12.png をPlantUMLで再現#