5. GNUPLOT の利用#
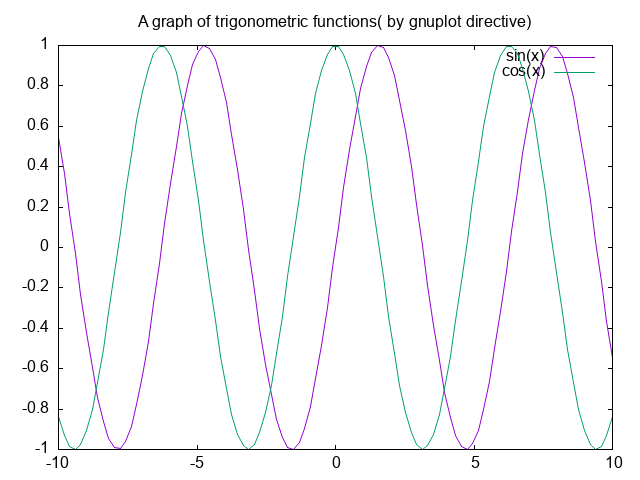
散布図など一般的なグラフであれば、gnuplotなどのグラフ作成ソフトを使うことも可能です。 gnuplotも拡張機能を使うとこで、Sphinx document中にグラフを埋め込めることができます。

sphinx-plot-directive 拡張 [1] を使った場合, 出力形式の指定 png は pangopng に強制的に変換されます(pangoがインストールされていないとpngにならない)。 svg はLaTeXで取り扱えない様です。

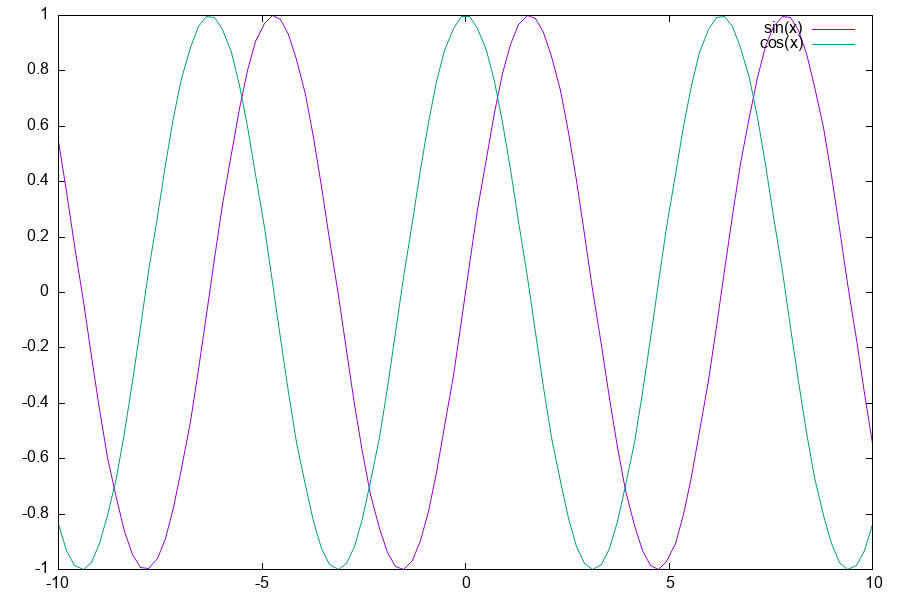
図 5.1 A graph of trigonometric functions( by plot directive)#
6. matplotli.sphinxext#
matplitlibのグラフをsphinxに取り込むこともできます。matplotlib.sphinxに三つのsphixextが含まれています。 上記のplotディレクティブと衝突してしまうので、plot-mplと名前を変えています。
6.1. matplotlib.sphinxext.plot_directive#
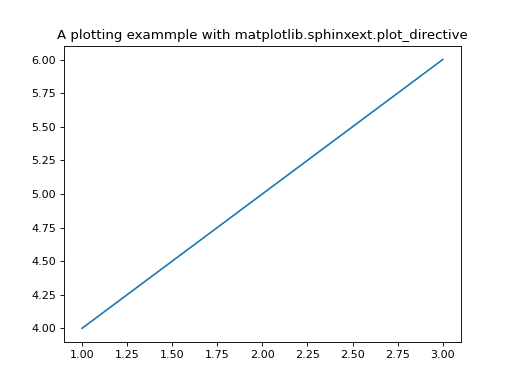
import matplotlib.pyplot as plt
plt.plot([1, 2, 3], [4, 5, 6])
plt.title("A plotting exammple with matplotlib.sphinxext.plot_directive")
(Source code, png, hires.png, pdf, svg)

configのオプション plot_formats に従って、複数の解像度/フォーマットでグラフのファイルが作成されます。
plot_srcset をに複数の係数を指定すると、 figure-mpl が使われて, responsibleなグラフとなります。
6.2. matplotlib.sphinxext.mathmpl#
ディレクティブ:rst:dir:mathmpl を math ディレクティブと同様に使って文章中に数式を埋め込めます。
Here is some standalone math:

 の様にロールとして
 mathmpl を文中で使うこともできます。
6.3. matplotlib.sphinxext.figmpl_directive#
figure-mlp はplot-mplの中で図を埋め込むために使うことを想定している様です。
単独での利用は想定されていないようですが、単独で利用することも可能ではあります。

responsive graph with figure-mpl